Graphically representing estimation table
Series: Miscellaneous
Use ggplot to visually explain output from a typical econometric estimation
Use ggplot to visually explain output from a typical econometric estimation

This blog post demonstrates how the mechanism of GMM estimation. I construct a GMM estimator from scratch to demonstrate its basic principles

This blog post demonstrates how the mechanism of GMM estimation. I construct a GMM estimator from scratch to demonstrate its basic principles
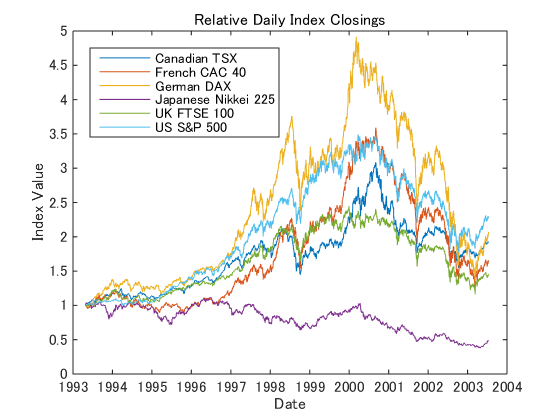
Codes to create scientific plots in ggplot2 that look like Matlab plots but applied to facets

Codes to create scientific plots in ggplot2 that look like Matlab plots